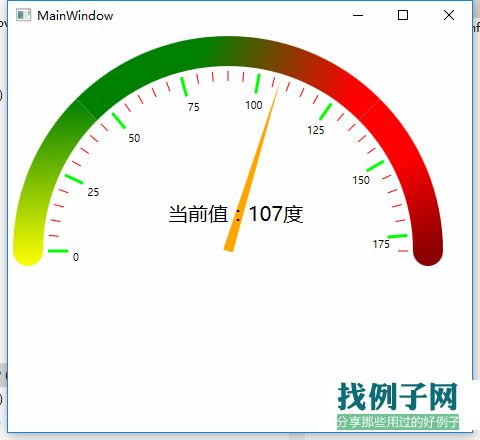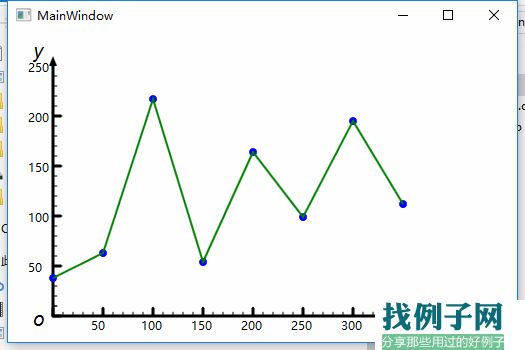
 using System;using System.Collections.Generic;using System.Linq;using System.Text;using System.Threading.Tasks;using System.Windows;using System.Windows.Controls;using System.Windows.Data;using System.Windows.Documents;using System.Windows.Input;using System.Windows.Media;using System.Windows.Media.Imaging;using System.Windows.Navigation;using System.Windows.Shapes;namespace SimpleChart{ /// <summary> /// MainWindow.xaml 的交互逻辑 /// </summary> public partial class MainWindow : Window { private List<Point> dataPoints = new List<Point>(); private PointCollection coordinatePoints = new PointCollection(); private List<Ellipse> pointEllipses = new List<Ellipse>(); Polyline curvePolyline = new Polyline(); public MainWindow() { InitializeComponent(); curvePolyline.Stroke = Brushes.Green; curvePolyline.StrokeThickness = 2; DrawScale(); DrawScaleLabel(); DrawPoint(); DrawCurve(); } /// <summary> /// 作出箭头 /// </summary> private void DrawArrow() { Path x_axisArrow = new Path();//x轴箭头 Path y_axisArrow = new Path();//y轴箭头 x_axisArrow.Fill = new SolidColorBrush(Color.FromRgb(0xff, 0, 0)); y_axisArrow.Fill = new SolidColorBrush(Color.FromRgb(0xff, 0, 0)); PathFigure x_axisFigure = new PathFigure(); x_axisFigure.IsClosed = true; x_axisFigure.StartPoint = new Point(480, 276); //路径的起点 x_axisFigure.Segments.Add(new LineSegment(new Point(480, 284), false)); //第2个点 x_axisFigure.Segments.Add(new LineSegment(new Point(490, 280), false)); //第3个点 PathFigure y_axisFigure = new PathFigure(); y_axisFigure.IsClosed = true; y_axisFigure.StartPoint = new Point(36, 30); //路径的起点 y_axisFigure.Segments.Add(new LineSegment(new Point(44, 30), false)); //第2个点 y_axisFigure.Segments.Add(new LineSegment(new Point(40, 20), false)); //第3个点 PathGeometry x_axisGeometry = new PathGeometry(); PathGeometry y_axisGeometry = new PathGeometry(); x_axisGeometry.Figures.Add(x_axisFigure); y_axisGeometry.Figures.Add(y_axisFigure); x_axisArrow.Data = x_axisGeometry; y_axisArrow.Data = y_axisGeometry; this.chartCanvas.Children.Add(x_axisArrow); this.chartCanvas.Children.Add(y_axisArrow); } /// <summary> /// 作出x轴和y轴的标尺 /// </summary> private void DrawScale() { for (int i = 0; i < 45; i = 1)//作480个刻度,因为当前x轴长 480px,每10px作一个小刻度,还预留了一些小空间 { //原点 O=(40,280) Line x_scale = new Line(); x_scale.StrokeEndLineCap = PenLineCap.Triangle; x_scale.StrokeThickness = 1; x_scale.Stroke = new SolidColorBrush(Color.FromRgb(0, 0, 0)); x_scale.X1 = 40 i * 10; //原点x=40,每10px作1个刻度 x_scale.X2 = x_scale.X1; //在x轴上的刻度线,起点和终点相同 x_scale.Y1 = 280; //与原点坐标的y=280,相同 if (i % 5 == 0)//每5个刻度添加一个大刻度 { x_scale.StrokeThickness = 3;//把刻度线加粗一点 x_scale.Y2 = x_scale.Y1 - 8;//刻度线长度为8px } else { x_scale.Y2 = x_scale.Y1 - 4;//刻度线长度为4px } if (i < 25)//由于y轴短一些,所以在此作出判断,只作25个刻度 { //作出Y轴的刻度 Line y_scale = new Line(); y_scale.StrokeEndLineCap = PenLineCap.Triangle; y_scale.StrokeThickness = 1; y_scale.Stroke = new SolidColorBrush(Color.FromRgb(0, 0, 0)); y_scale.X1 = 40; //原点x=40,在y轴上的刻度线的起点与原点相同 if (i % 5 == 0) { y_scale.StrokeThickness = 3; y_scale.X2 = y_scale.X1 8;//刻度线长度为4px } else { y_scale.X2 = y_scale.X1 4;//刻度线长度为8px } y_scale.Y1 = 280 - i * 10; //每10px作一个刻度 y_scale.Y2 = y_scale.Y1; //起点和终点y坐标相同 this.chartCanvas.Children.Add(y_scale); } this.chartCanvas.Children.Add(x_scale); } } /// <summary> /// 添加刻度标签 /// </summary> private void DrawScaleLabel() { for (int i = 1; i < 7; i )//7 个标签,一共 { TextBlock x_ScaleLabel = new TextBlock(); TextBlock y_ScaleLabel = new TextBlock(); x_ScaleLabel.Text = (i * 50).ToString();//只给大刻度添加标签,每50px添加一个标签 Canvas.SetLeft(x_ScaleLabel, 40 5 * 10 * i - 12);//40是原点的坐标,-12是为了让标签看的位置剧中一点 Canvas.SetTop(x_ScaleLabel, 280 2);//让标签字往下移一点 y_ScaleLabel.Text = (i * 50).ToString(); Canvas.SetLeft(y_ScaleLabel, 40 - 25); //-25px是字体大小的偏移 Canvas.SetTop(y_ScaleLabel, 280 - 5 * 10 * i - 6); //280px是原点的坐标,同样-6是为了让标签不要上坐标轴叠上 this.chartCanvas.Children.Add(x_ScaleLabel); this.chartCanvas.Children.Add(y_ScaleLabel); } } private void DrawPoint() { //随机生成8个点 Random rPoint = new Random(); for (int i = 0; i < 8; i ) { int x_point = i * 50; int y_point = rPoint.Next(250); dataPoints.Add(new Point(x_point, y_point)); } for (int i = 0; i < dataPoints.Count; i ) { Ellipse dataEllipse = new Ellipse(); dataEllipse.Fill = new SolidColorBrush(Color.FromRgb(0, 0, 0xff)); dataEllipse.Width = 8; dataEllipse.Height = 8; pointEllipses.Add(dataEllipse); Canvas.SetLeft(pointEllipses[i], 40 dataPoints[i].X - 4);//-4是为了补偿圆点的大小,到精确的位置 Canvas.SetTop(pointEllipses[i], 280 - dataPoints[i].Y - 4); //将数据点在画布中的位置保存下来 coordinatePoints.Add(new Point(40 dataPoints[i].X, 280 - dataPoints[i].Y)); chartCanvas.Children.Add(pointEllipses[i]); } } private void DrawCurve() { curvePolyline.Points = coordinatePoints; chartCanvas.Children.Add(curvePolyline); } private void AddCurvePoint(Point dataPoint) { dataPoints.RemoveAt(0); dataPoints.Add(dataPoint); for (int i = 0; i < dataPoints.Count; i ) { //每一个点的X数据都要向左移动50px dataPoints[i] = new Point(dataPoints[i].X - 50, dataPoints[i].Y); coordinatePoints[i] = new Point(40 dataPoints[i].X, 280 - dataPoints[i].Y); Canvas.SetLeft(pointEllipses[i], 40 dataPoints[i].X - 4);//-4是为了补偿圆点的大小,到精确的位置 Canvas.SetTop(pointEllipses[i], 280 - dataPoints[i].Y - 4); } } private void chartCanvas_MouseDown(object sender, MouseButtonEventArgs e) { //随机生成Y坐标 Point dataPoint = new Point(400, (new Random()).Next(250)); AddCurvePoint(dataPoint); } }}


评论